Welcome to CatchIS

Virtual Session
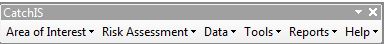
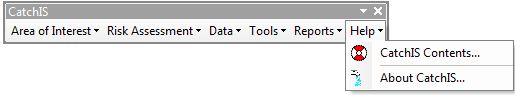
Menu overview
Controlling a CatchIS session
CatchIS uses a powerful Mouse-driven Graphical User Interface (for instance to select an area, select a model to run and then to inspect and report on the results).
- CatchIS can use your company's GIS data and topographical vector and raster data (e.g. Ordnance Survey Landranger tiles) for location and presentational purposes. Company GIS boundaries such as WSZ, DMA etc. can be used to define the area of interest for modelling.
- CatchIS contains the unique soil and environmental datasets of Cranfield University's National Soil Resources Institute (NSRI) and ADAS.
- CatchIS can produce a broad range of visual reports, plots and analyses relating to the model results and predictions. Data is output to standard office software such as Microsoft Excel.
- The CatchIS framework is modular - it currently holds eight risk assessment/vulnerability models and related scenarios.
- CatchIS has a simple to use Wizard interface to guide you through the process of selecting and running models if you are not used to using the system.
Area of Interest
Selecting the focus for the model runs
The first requirement in CatchIS is to define an area of interest (AOI) which is used subsequently for analysis, reporting and statistical purposes.
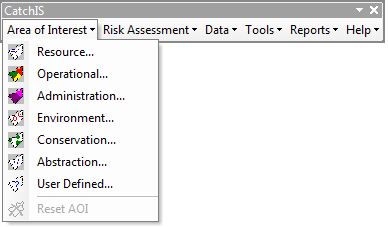
CatchIS allows a wide range of AOI selections to be made - ranging from company boundaries to environmental boundaries, and from regulator boundaries to user-defined boundaries.
Selections via ‘Area Of Interest’ menu, pointing and direct queries