Welcome to CatchIS

Surface water pesticides
Protecting the surface water source
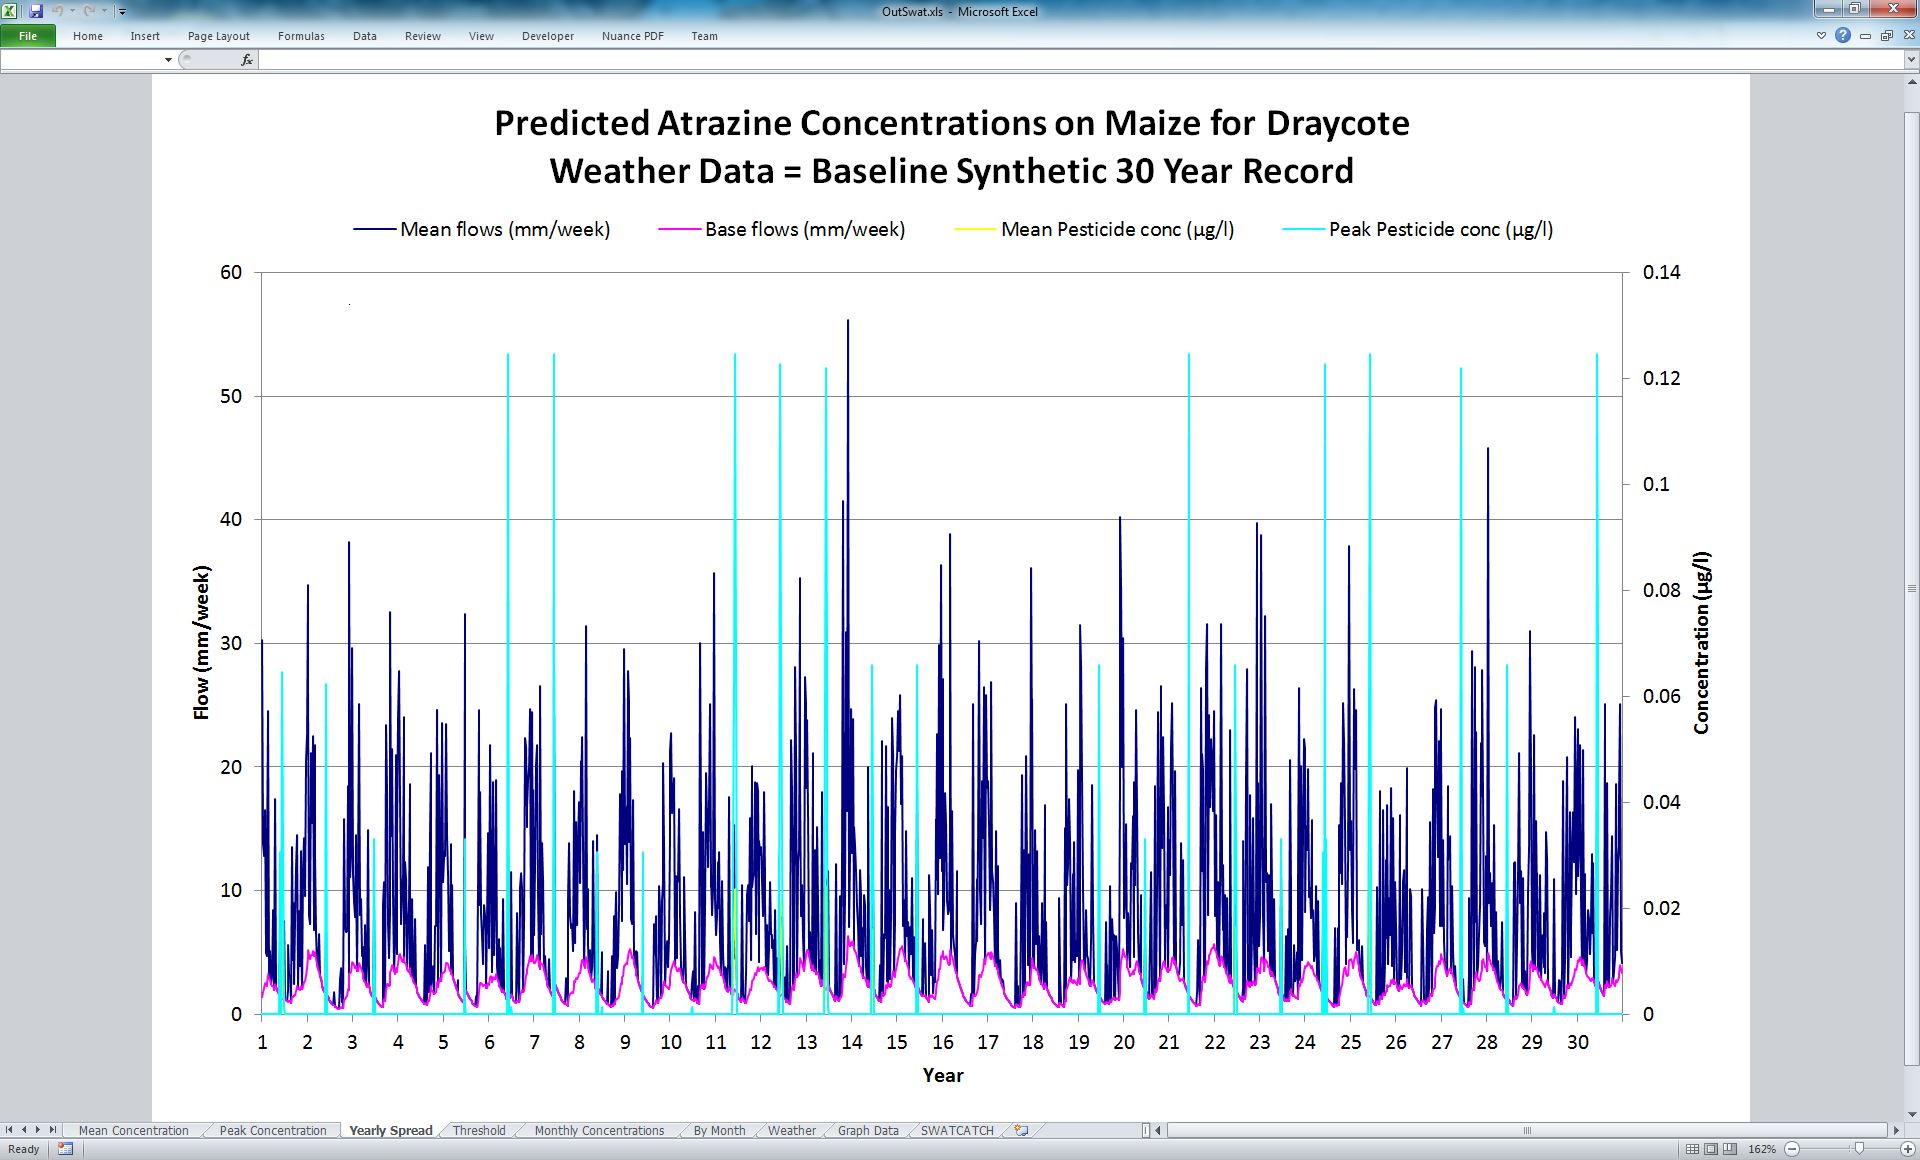
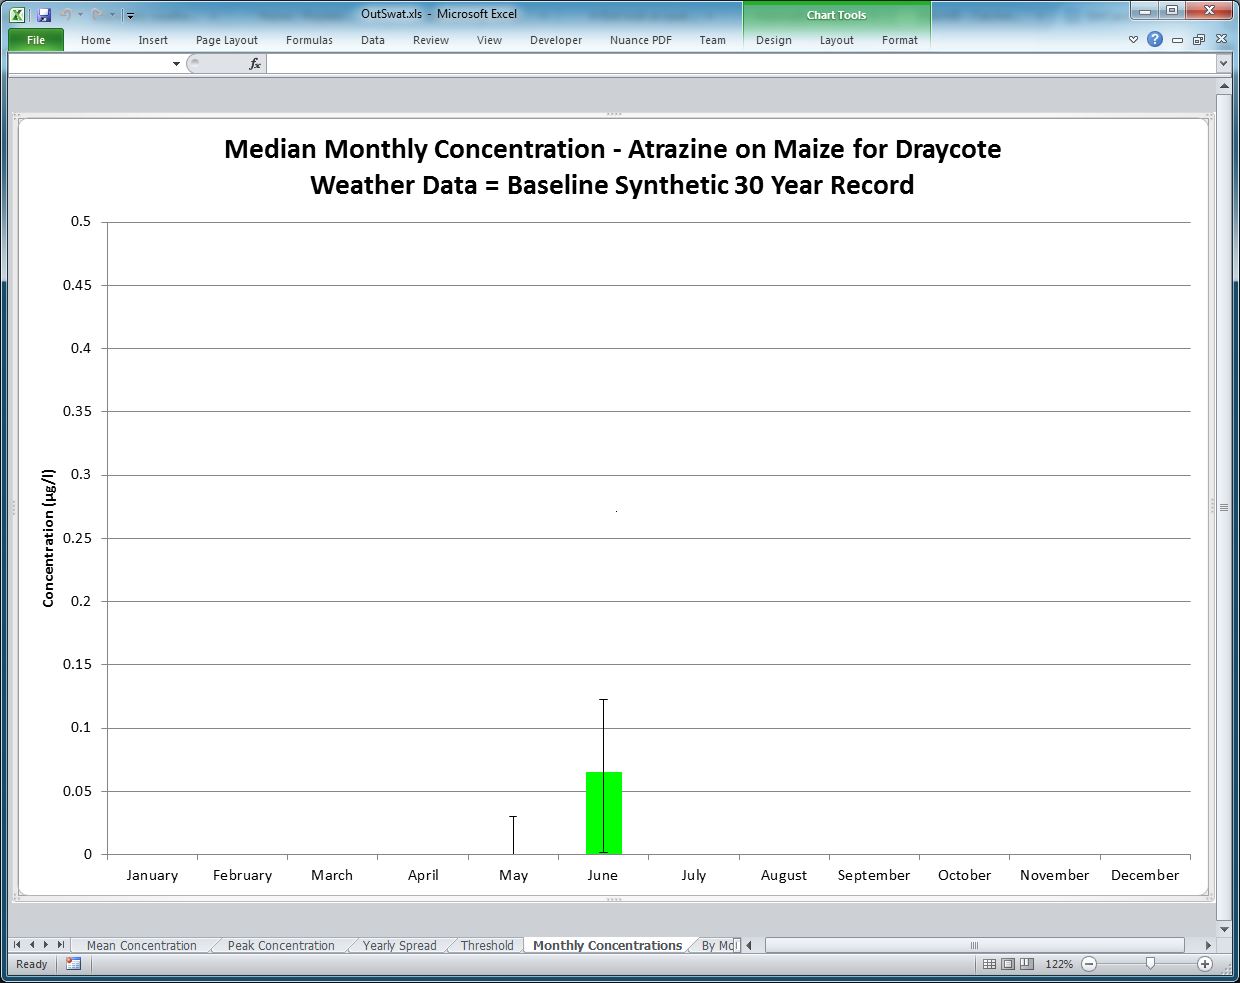
The model SWATCATCH computes a time series flows and concentrations that can be expected at the catchment outlet / abstraction point following use of a specific compound on a specific crop. The results are compiled into a new Excel spreadsheet.
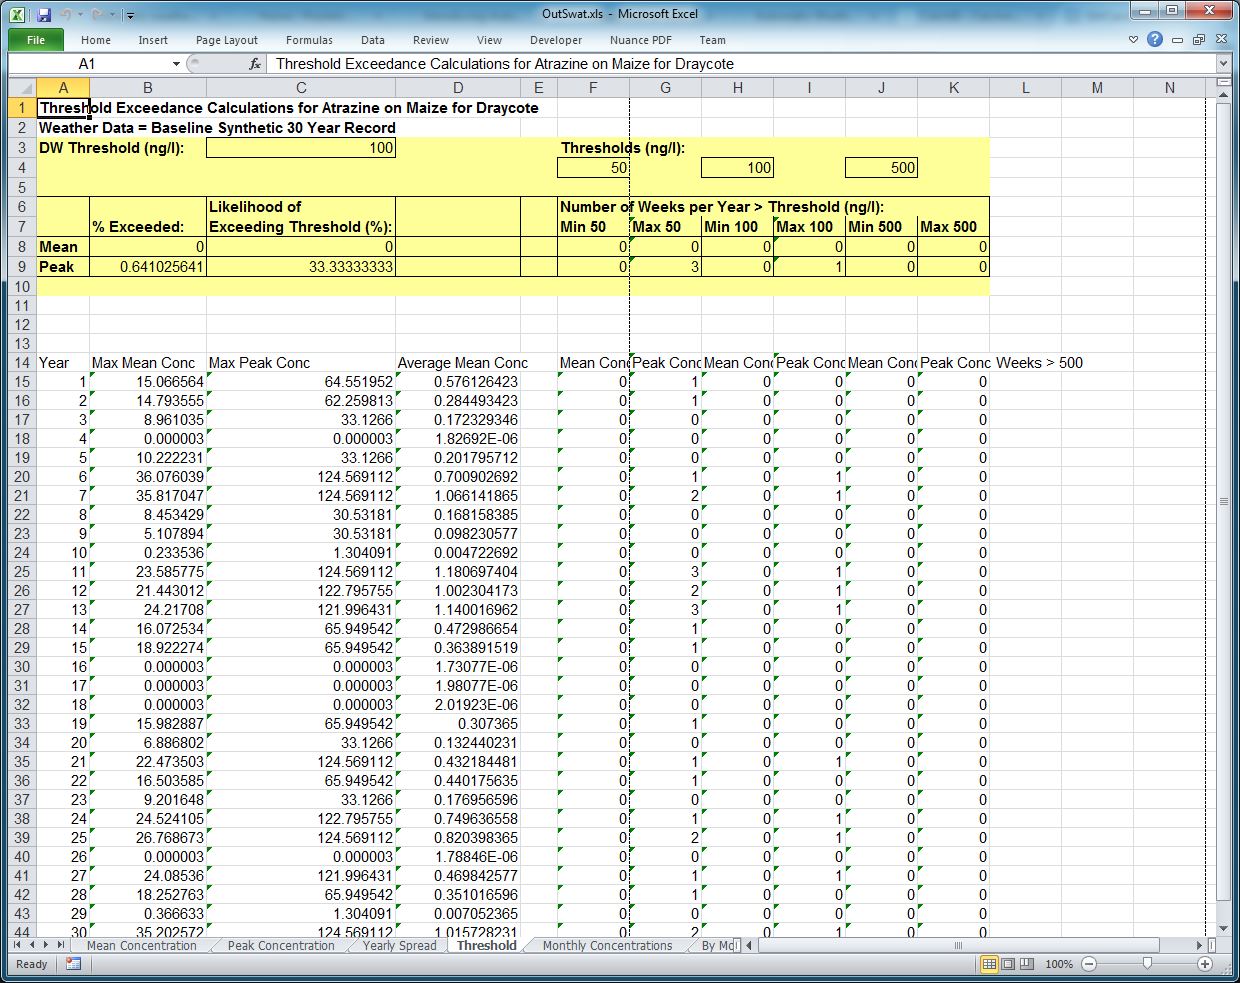
You can also consider the likelihood of exceeding a given threshold. The Threshold spreadsheet in Excel may be used to give a probability of exceedence as a percentage given a user specified threshold concentration.
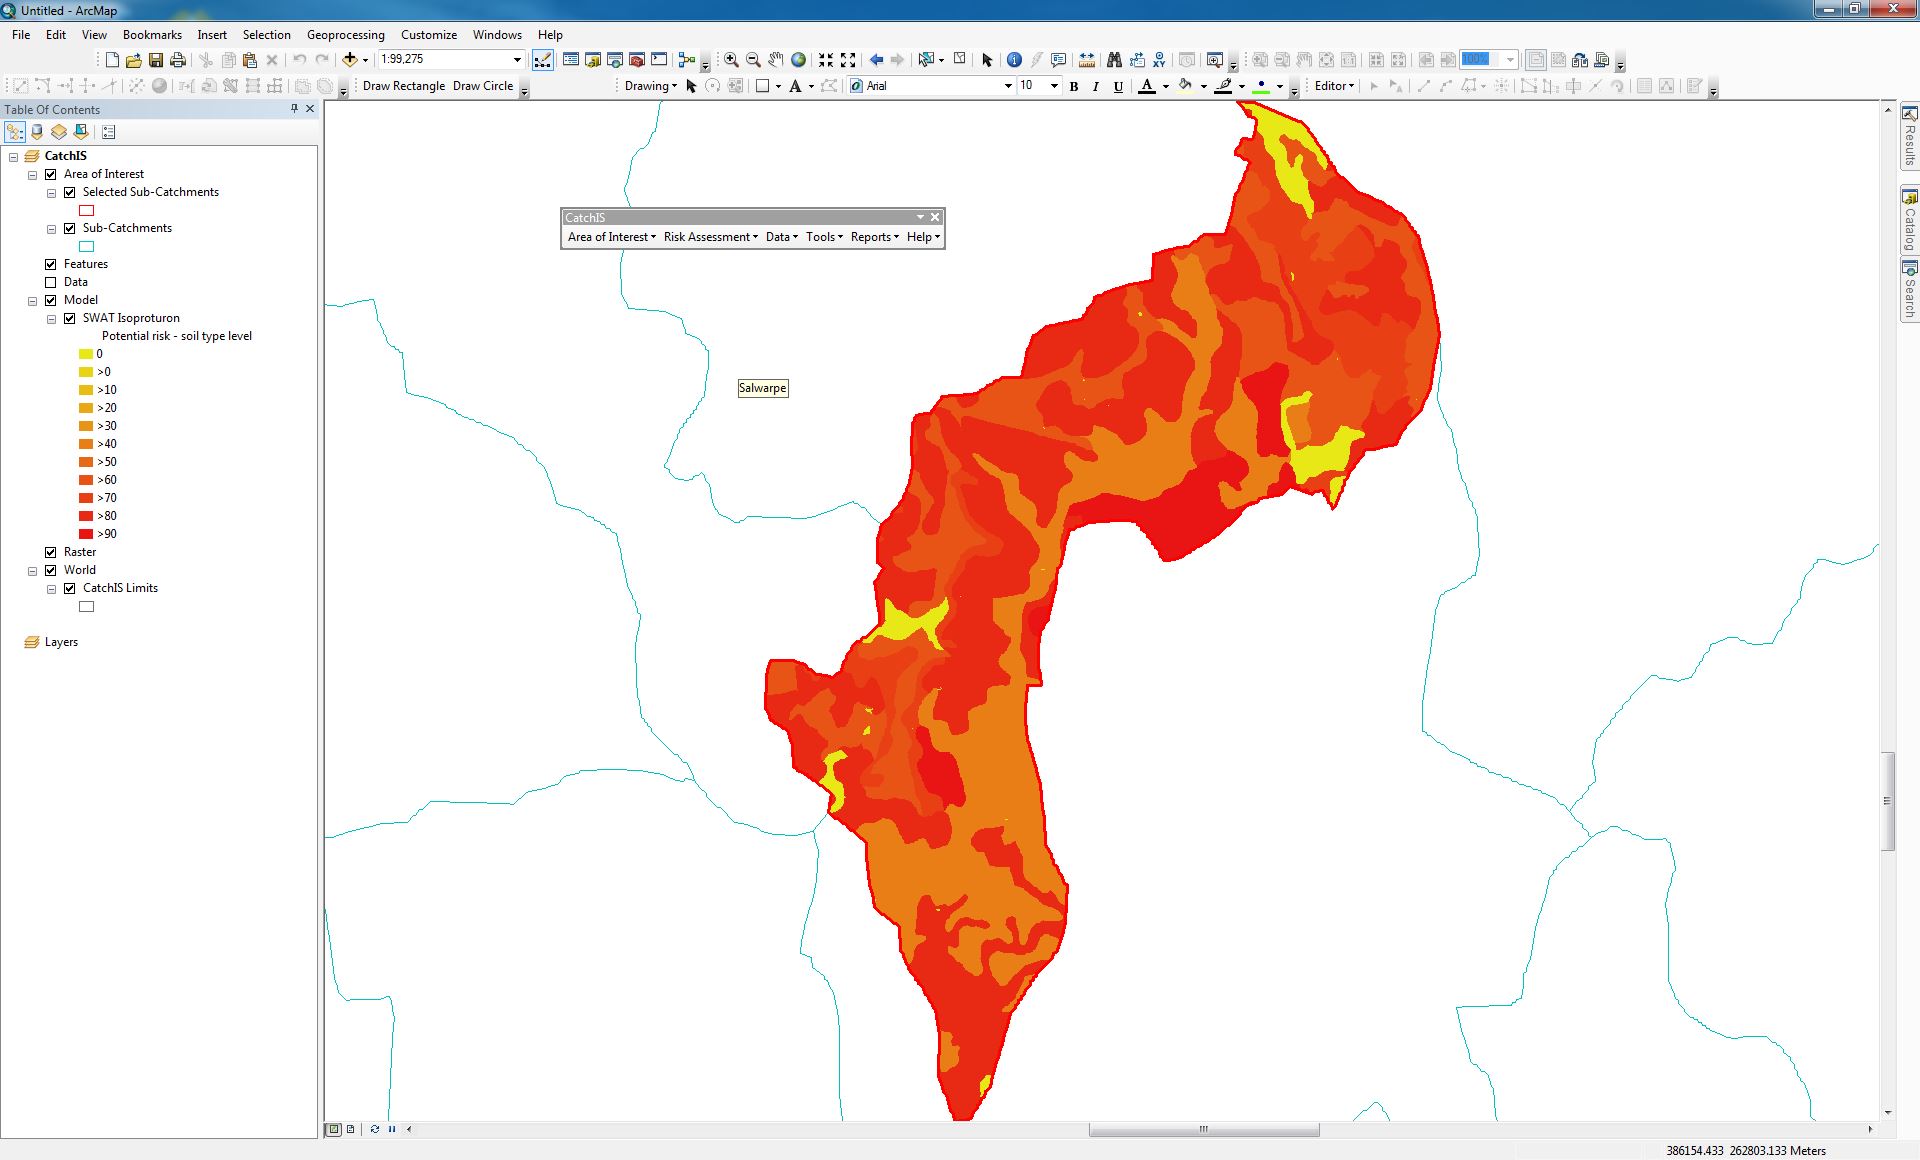
Surface water hotspots
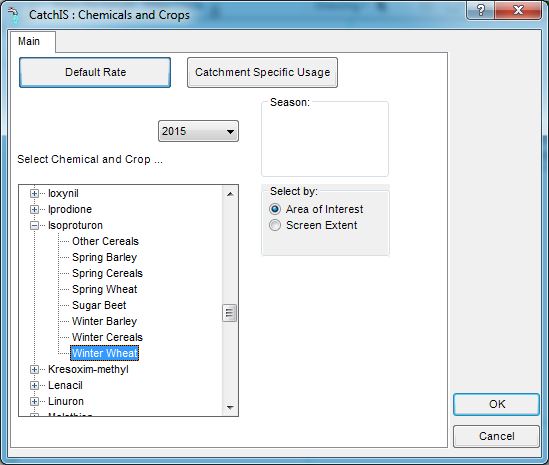
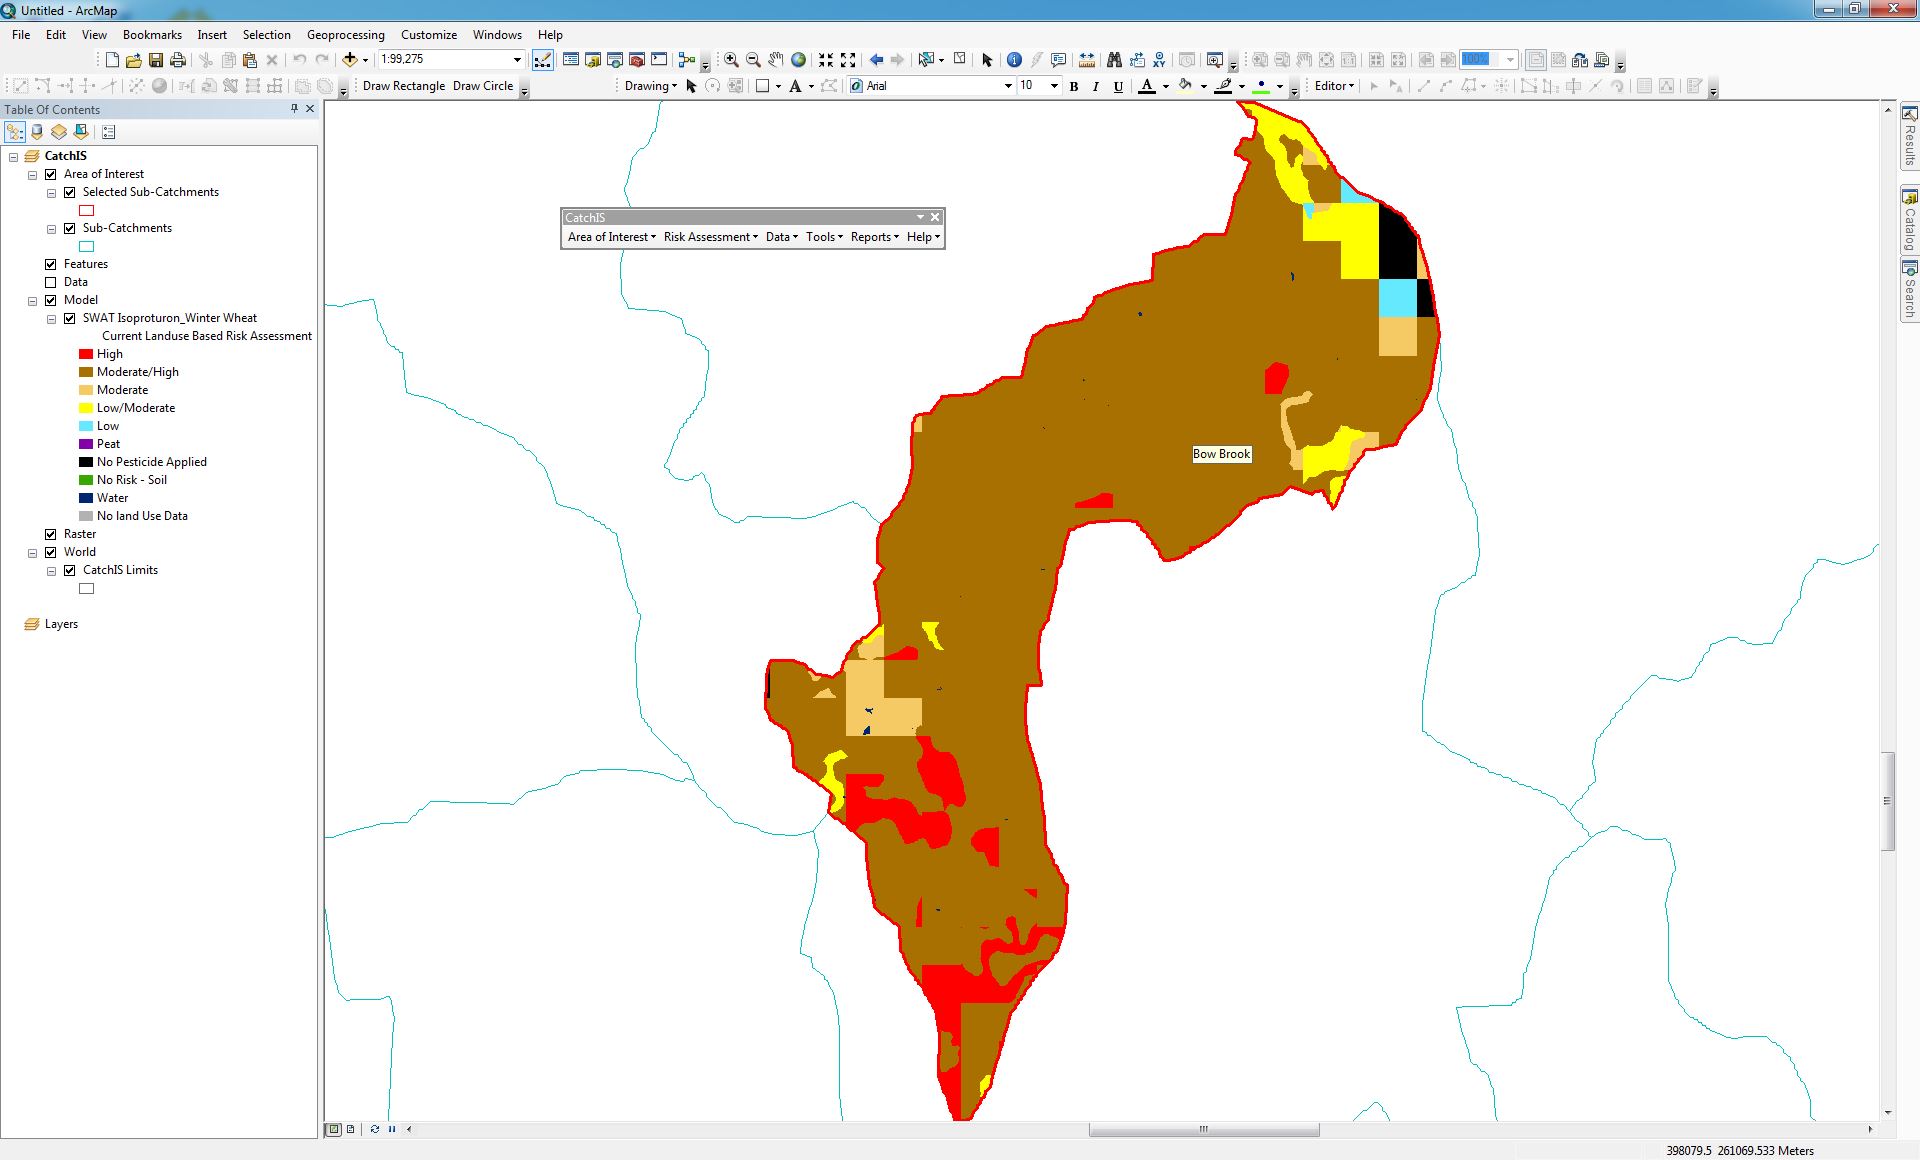
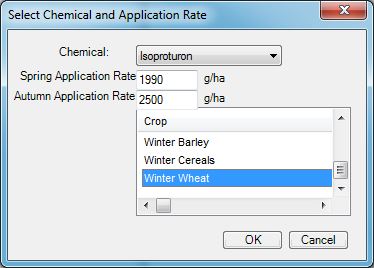
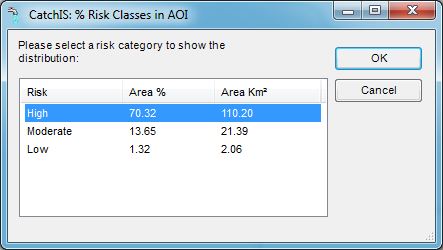
Identification of spatial risk
The surface water hotspots model allows you to identify hotspots within the catchment (or AOI) which are particularly vulnerable to a particular compound. The compound can either be applied everywhere, irrespective of cropping or land use (vulnerability potential), or utilise the actual landcover data from ADAS UK Ltd. to identify crop-specific hot spots.